Toronto, Hamilton GTA Real Estate Stats August 2021
Toronto, Hamilton GTA Real Estate Stats August 2021
Below you will find Toronto GTA Real Estate Stats for Toronto, Oakville, Mississauga, Milton, Burlington, Hamilton, Kitchener, and Waterloo. The recent August 2021 real estate stats below show accurate numbers from the Toronto Real Estate Board, showcasing the number of sales, average price, and the median price for Toronto, and GTA West – Oakville, Mississauga, Milton, Burlington, Hamilton, Kitchener, and Waterloo. For specific stats on a particular Canadian city or neighbourhood please contact Real Estate Agent – Sean Findlay at 905-450-8300
Toronto Real Estate Stats
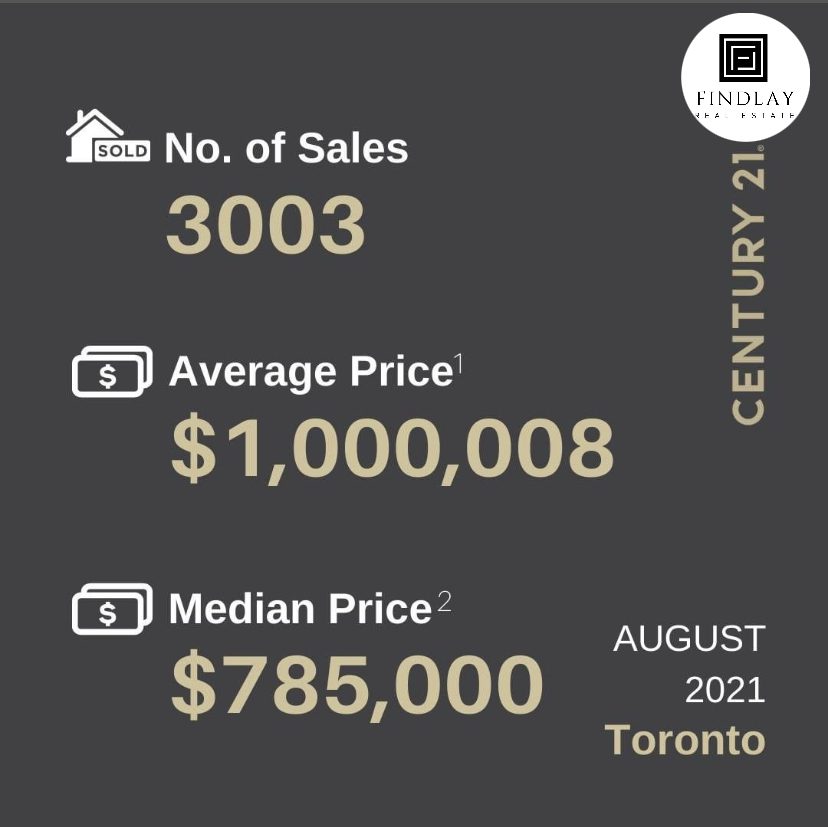
No. of Sales: Total number of sales for Toronto, Ontario = 3003 homes sold
Average Price: For the month of August 2021, the average price of a home sold in Toronto, Ontario = $1,000,008
Median Price: For the month of August 2021, the median price of a home sold in Toronto, Ontario = $785,000

Oakville Real Estate Stats
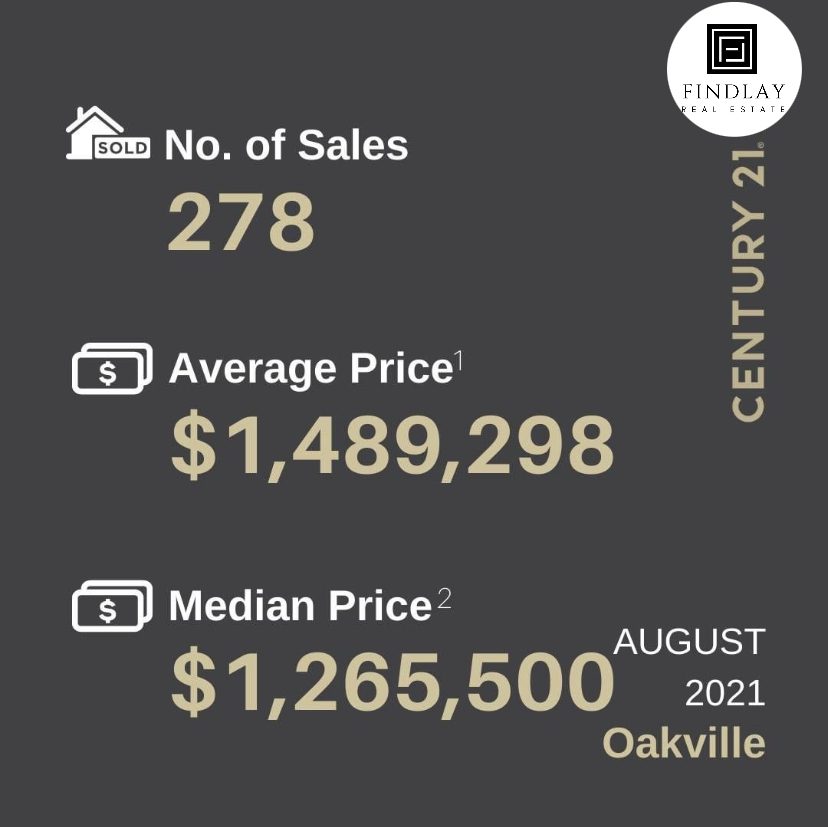
No. of Sales: Total number of sales for Oakville, Ontario = 278 homes sold in August 2021.
Average Price: For the month of August 2021, the average price of a home sold in Oakville, Ontario = $1,489,298
Median Price: For the month of August 2021, the median price of a home sold in Oakville, Ontario = $1,265,500
Mississauga Real Estate Stats
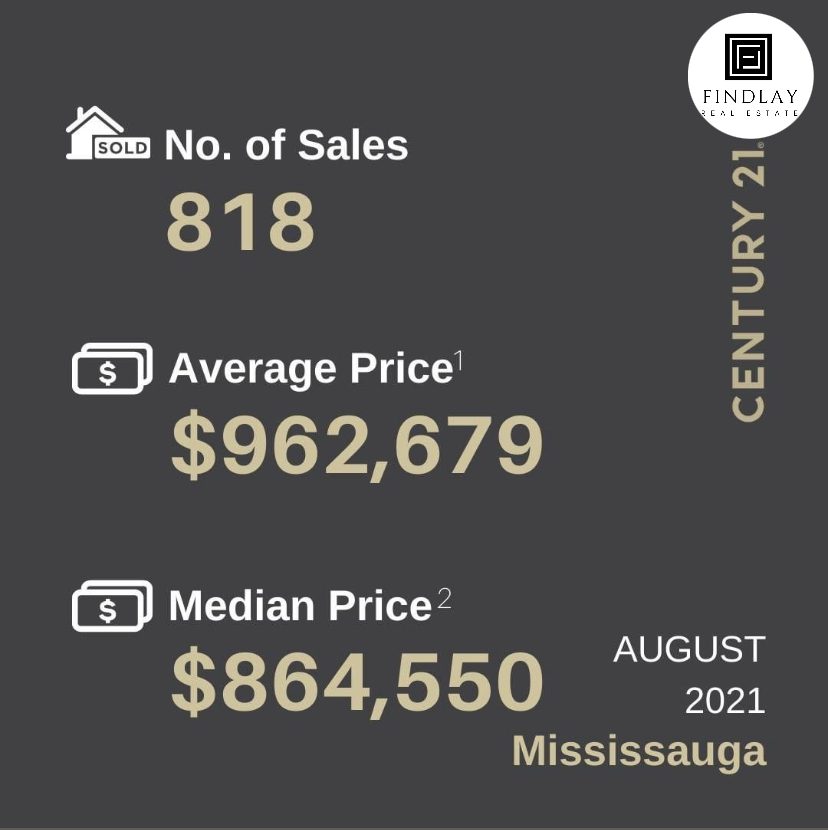
No. of Sales: Total number of sales for Mississauga, Ontario for August 2021 = 818 homes sold
Average Price: For the month of August 2021, the average price of a home sold in Mississauga, Ontario = $962,679
Median Price: For the month of August 2021, the median price of a home sold in Mississauga, Ontario = $864,550
Milton Real Estate Stats
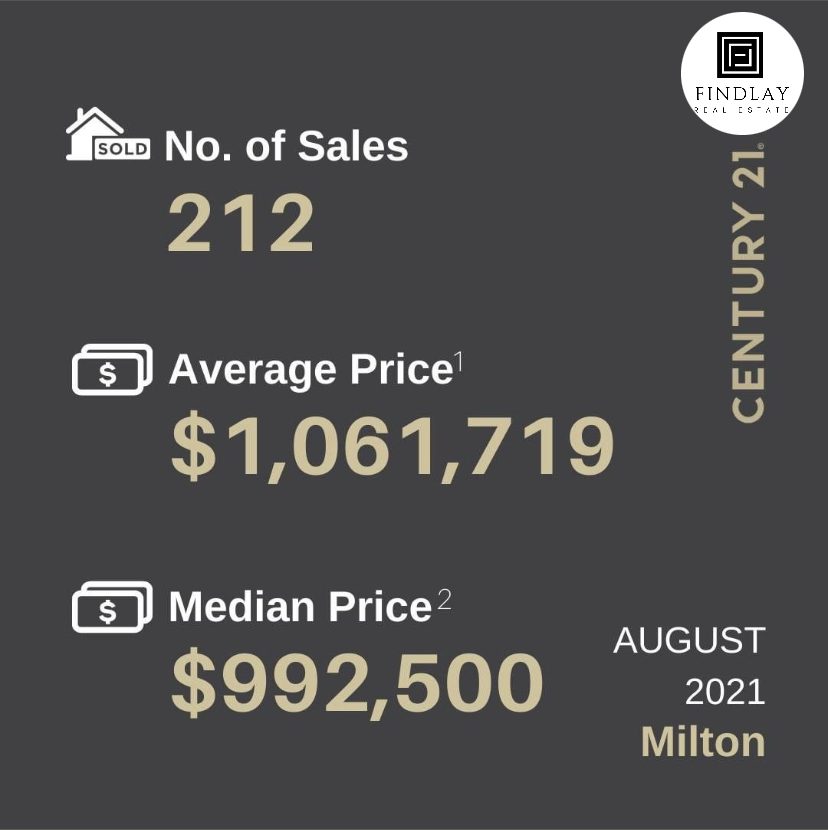
No. of Sales: Total number of sales for Milton, Ontario = 212 homes sold
Average Price: For the month of August 2021, the average price of a home sold in Milton, Ontario = $1,061,719
Median Price: For the month of August 2021, the median price of a home sold in Milton, Ontario = $992,500
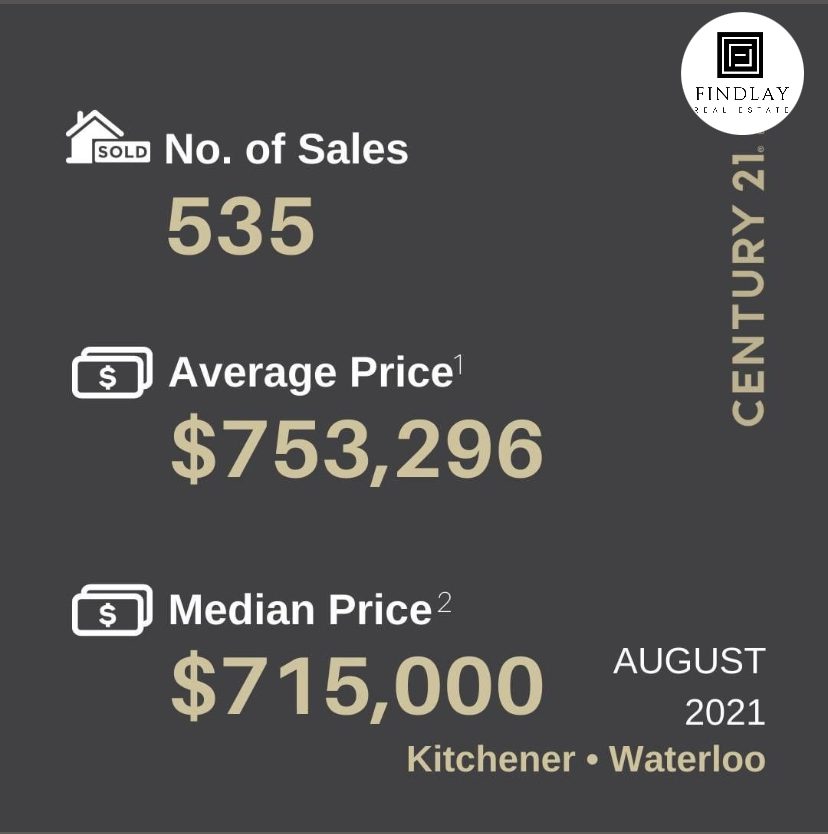
Kitchner / Waterloo Real Estate Stats
No. of Sales: Total number of sales for Kitchener & Waterloo, Ontario = 535 homes sold
Average Price: For the month of August 2021, the average price of a home sold in Kitchener & Waterloo, Ontario = $753,296
Median Price: For the month of August 2021, the median price of a home sold in Kitchener & Waterloo, Ontario = $715,000
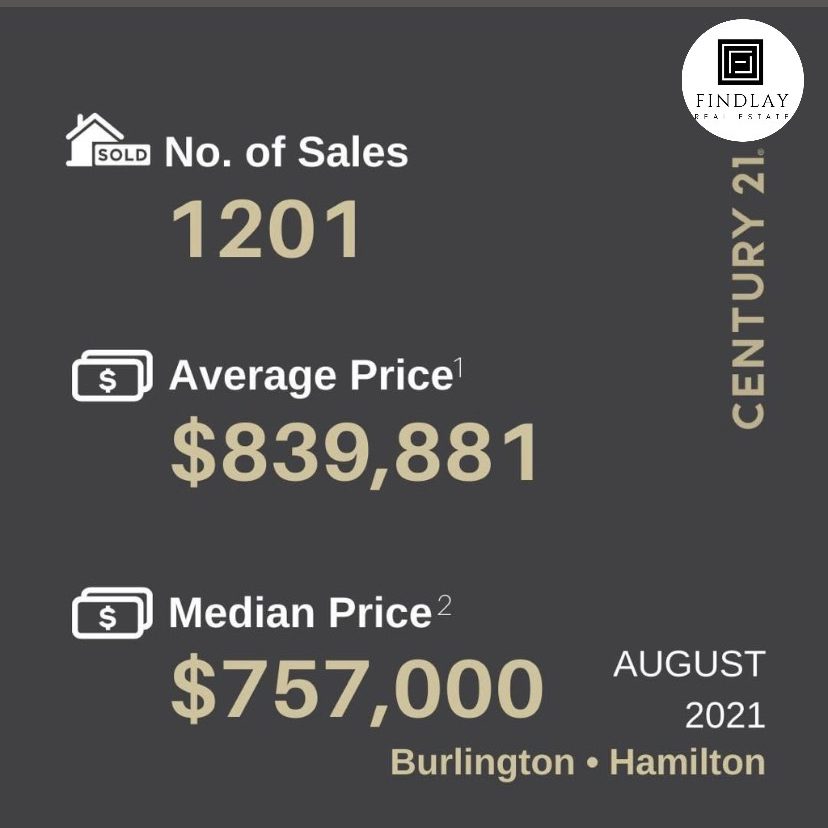
Burlington / Hamilton Real Estate Stats
No. of Sales: Total number of sales for Burlington & Hamilton, Ontario = 1201 homes sold
Average Price: For the month of August 2021, the average price of a home sold in Oakville, Ontario = $839,881
Median Price: For the month of August 2021, the median price of a home sold in Oakville, Ontario = $757,000
For more Information, or to get a Free Home Evaluation Please Contact Realtor Sean Findlay at 905-450-8300, or click here to schedule an appointment.

